Posts

Showing posts with the label VBA Macros Classes in Gurgaon

Creating a one-dimensional summary in Excel

Image
Creating a one-dimensional summary Now that we have created our Pivot Table, let's start by creating a basic summary of total sales by customer. Firstly, add the Customer field to the summary. You can do this job, by either clicking the checkbox next to the Customer field in the PivotTable Field List, or by dragging the Customer field into the Row Labels section. Once we have done this, notice a few things: first, the Customer field has appeared in the Row Labels section of our sidebar. Second, a list of customer names has appeared within our Pivot Table. A list of customer names is very nice to have, but not particularly useful for data analysis purposes. Let us make things more useful by dragging the Total Price field into the Values section of our Pivot Table: Now we are getting somewhere! Our table has summed up the values in the Total Price column, segmented by the customer type. Notice that Excel has also automatically generated a Grand Total row that shows the total...

Making the Pivot Table in Excel

Image
Making the Pivot Table Now that our data is set in the right format, we can move on to creating the pivot table itself. For this tutorial, we have expanded on the sample data set above, adding in some more granular detail on the items ordered, quantity, price, and date: To create a Pivot Table based off of this data, we will first place our cursor anywhere within the data set itself. Then, we will go to the Insert section on the Ribbon and select the Pivot Table option: The Create Pivot Table dialogue box will open asking us to specify some of the options. Since Excel has already selected our data and the rest of the options work by default (e.g., we want our Pivot Table report to be placed in a new sheet), so we can now go ahead and just press OK on this screen. Our Pivot Table is ready to go! Notice that Excel has created a new sheet; there is now a Pivot Table graphic on the left-hand side of the screen; and a PivotTable Field List dialogue that has appeared on the righ...

What is Pivot Table Example?

Image
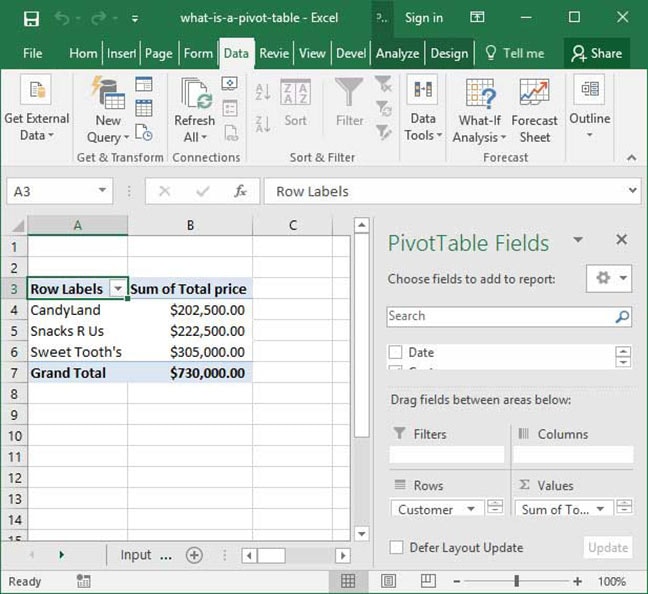
So, how does using a pivot table to perform large scale enterprise business calculations look like? Check out the below example, in which we have used the Excel tool named Pivot Table to complete the task mentioned in the earlier blog i.e. Summing sales in dollars by customer. We were able to prepare the report in a matter of few seconds based on the input data tab. Take Note of a couple of things: it has captured the data we wanted (the sum of the Total Price column, segmented by customer); it has included a comprehensive list of customers on our input sheet; and it is ready for flexible adjustments and modification (see the Pivot Table Field List dialogue on the right-hand side of the screen). We have solved our analyst's problem. Potential uses of Pivot Tables At higher levels, Pivot Tables are more effectively used to summarize the data. Beyond that, they are infinitely flexible, and applicable to a huge variety of situations. Here are some of the more example scenarios...

What is a Pivot Table?

Image
Pivot Table If you're a beginner or an intermediate Excel user, you may have definitely heard about Pivot Tables in Excel. This tool is one of the incredibly important part of any analyst's Excel toolkit, and appears frequently in Excel-based job interviews like the Uber Analytics interview. But what is a Pivot Table, and how it helps Excel Users analyze data more effectively? In this article, we'll go through the basics of Pivot Tables, explaining what they are and how to use them in daily practice. Simply defined, a Pivot Table is a tool built into Excel that allows one to summarize large quantities of data in a quick and easy way. Given an input table with tens, hundreds, or even thousands of rows, Pivot Tables allows one to extract answers to a series of basic questions about your data with the minimal effort. That may all seem a bit abstract, so let's dive into a real-world example, so as to get an idea about what a Pivot Table really is. Defining the pr...

What are the various Formatting options available in Excel?

Image
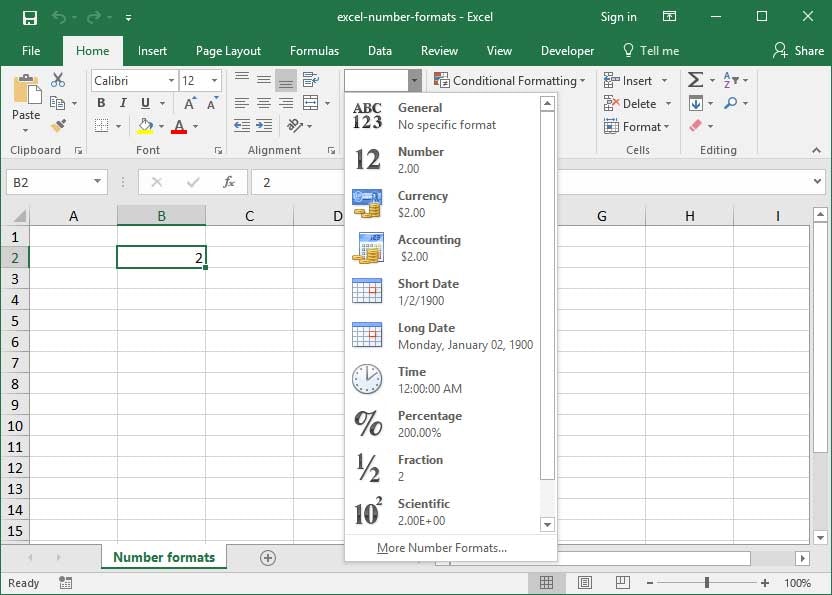
We can have a look at the various formatting options available in Excel by selecting a cell that contains a number and from thereon heading towards the Number formatting drop-down on the Home ribbon tab: Following are the most used formatting options that are available in Excel: Number. Excel would format your input as a generic number with commas in-between the thousands digits. Currency. Excel would format your input with a currency sign in front of it and two trailing digits after the decimal point. Accounting. Similar as the Currency format, but currency sign will align to the left-hand side of the cell. Date. Excel would format the given input as a date. Note that dates in the Excel are displayed as numerical quantities. Time. Excel would format the given input as a date or time. Times are also displayed as numerical quantities in the Excel. Percentage. Excel would format the given input as a Percentage. Like, an input of 0.76 will be read as 76%. It is important to not...

Formatting cells in Excel

Image
Till now we have learned how to navigate Excel spreadsheets, resize rows and columns, and format numbers. Then how does the Excel experts make their sheets look so beautiful? To answer that question, we will have a look at the options that Excel includes for cell formatting. Basic text formatting If we select any of the cell and head to the Home tab on the Ribbon, we will get to see some of the basic formatting options at the top of the ribbon: Font style and size Bold Underline, and Italics And borders Of particular note are the font color and cell background color drop-downs, which allow us to style cells as we see we want: To the right, we will see a number of paragraph options, including: Cell vertical alignment (top, middle, or bottom) Horizontal alignment (left, right, and center) And indentation The "wrap text" option on this page allows one to toggle text wrapping within a cell on or off. If toggled on, text within a cell will automatic...

How to Use Tables in Excel?

Image
Almost all of the data that we input into Excel is structured in table format — meaning that it is organized in a grid of columns and rows. Sometimes, this data takes the form of a free-flowing analysis, where rows, columns, and cells are combined together to do a calculation, estimation, or prediction. But some of the times, Excel is used just to organize the large quantities of data. For example, the below spreadsheet tracks orders are placed by SnackWorld's customers from Financial Year 2014-2016. Every line of the spreadsheet has directly comparable data: Information on one order Like the order date Item name Quantity Unit price. In the latter case, Excel has an extremely incredible handy feature that helps us organize and manipulate similar rows of data in a more effective way: Tables. Not to be confused with 'tables'-with-a-lower-case-T, our generic term for data sets organized into rows and columns, Tables-with-a-capital-T are a specific Excel feature...