Posts

Showing posts with the label mis course in gurgaon

How to do Sorting or Alphabetizing in a custom order?

Image
The traditional sorting methods that we've been using so far present a small problem: what happens if we want to order our list chronologically month wise? Our month names have been entered as text strings rather than dates, so alphabetization will not work: if we sort from A to Z, February will come first, then January, followed by March. And if we sort the other way, March will come first, then January, followed by February. How can we get Excel to sort chronologically month wise without alphabetizing? The answer is simple: with the use of a Custom list. Try selecting your data table and opening the Sort dialogue once again: In the Column section, we will select Month, and in the Order section, we will select Custom List. When we do that, a new dialogue opens: This screen allows us to specify our own custom order of columns by typing them into the List entries section like so: Once you have done this, hit OK to confirm our custom sort and then OK again to perform the s...

How to Alphabetization by multiple columns in Excel?

Image
Now, it is time to get fancy. We have learned how to sort and alphabetize by a single column. But what if we wish to sort by multiple columns — for example, alphabetize our order list by customer name first, but within each "customer name" block sort from the highest-value order to the lowest-value order? We can do this by using Excel's full sort functionality feature. First, we will start by selecting the whole range of data we want to sort. You can do this by clicking and dragging with your mouse to select all the cells you wish to sort, but there is a shortcut: make sure a cell within your data table you have selected, then press Ctrl + A on a PC or ⌘ + A on a Mac. When you are making this selection, it is very important to check to ensure that your entire table is highlighted before proceeding. If there are blank rows, then they may cause the Ctrl + A shortcut to only highlight part of the table; this will mess up your sorting or only partially sort the data. Alway...

Creating a one-dimensional summary in Excel

Image
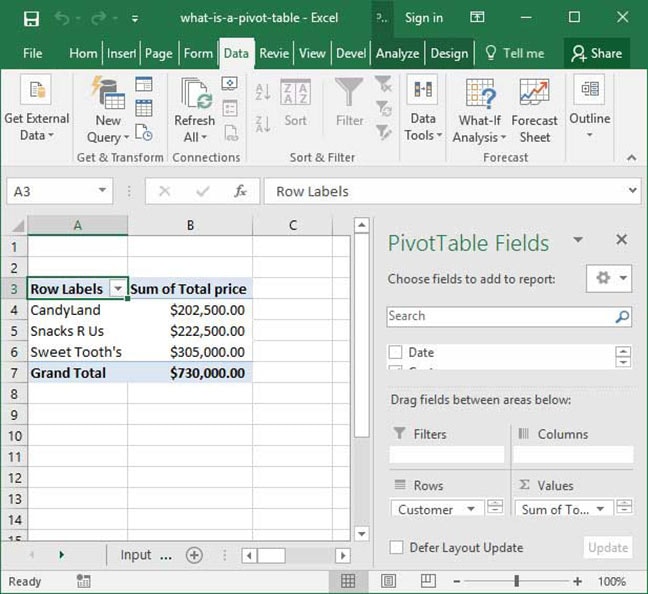
Creating a one-dimensional summary Now that we have created our Pivot Table, let's start by creating a basic summary of total sales by customer. Firstly, add the Customer field to the summary. You can do this job, by either clicking the checkbox next to the Customer field in the PivotTable Field List, or by dragging the Customer field into the Row Labels section. Once we have done this, notice a few things: first, the Customer field has appeared in the Row Labels section of our sidebar. Second, a list of customer names has appeared within our Pivot Table. A list of customer names is very nice to have, but not particularly useful for data analysis purposes. Let us make things more useful by dragging the Total Price field into the Values section of our Pivot Table: Now we are getting somewhere! Our table has summed up the values in the Total Price column, segmented by the customer type. Notice that Excel has also automatically generated a Grand Total row that shows the total...

Making the Pivot Table in Excel

Image
Making the Pivot Table Now that our data is set in the right format, we can move on to creating the pivot table itself. For this tutorial, we have expanded on the sample data set above, adding in some more granular detail on the items ordered, quantity, price, and date: To create a Pivot Table based off of this data, we will first place our cursor anywhere within the data set itself. Then, we will go to the Insert section on the Ribbon and select the Pivot Table option: The Create Pivot Table dialogue box will open asking us to specify some of the options. Since Excel has already selected our data and the rest of the options work by default (e.g., we want our Pivot Table report to be placed in a new sheet), so we can now go ahead and just press OK on this screen. Our Pivot Table is ready to go! Notice that Excel has created a new sheet; there is now a Pivot Table graphic on the left-hand side of the screen; and a PivotTable Field List dialogue that has appeared on the righ...

What is Pivot Table Example?

Image
So, how does using a pivot table to perform large scale enterprise business calculations look like? Check out the below example, in which we have used the Excel tool named Pivot Table to complete the task mentioned in the earlier blog i.e. Summing sales in dollars by customer. We were able to prepare the report in a matter of few seconds based on the input data tab. Take Note of a couple of things: it has captured the data we wanted (the sum of the Total Price column, segmented by customer); it has included a comprehensive list of customers on our input sheet; and it is ready for flexible adjustments and modification (see the Pivot Table Field List dialogue on the right-hand side of the screen). We have solved our analyst's problem. Potential uses of Pivot Tables At higher levels, Pivot Tables are more effectively used to summarize the data. Beyond that, they are infinitely flexible, and applicable to a huge variety of situations. Here are some of the more example scenarios...

What are the benefits of using Excel?

Image
What is Excel? It is a software program included in the MS-Office Suite. It is used to create spreadsheets, that are documents in which data is laid out in rows and tables like a big table. Because of its extreme versatility and power, it has become one of the most used software in the business world for creating and managing data, be it of small amount or large in size. It was officially launched for public use in 1985. Excel has been one of the contributing reasons, that drove personal computing revolution in 1980’s and 1990’s all across the world. What is a spreadsheet? It is a specialised way of data organisation into rows and columns, with an aim to make it simpler to read and change, as and when required by the user. What are the uses of Excel? Excel has to offer something to everyone. Spreadsheets that are extraordinary and powerful tools, are frequently used in the corporates i.e. commercially for data storage and manipulation. Below are some examples that wi...